For my financial analysis project, I used Microsoft Excel – 2008 Mac edition. This was honestly my first time using this type of software in a calculating way, that is. I have only used it for generating graphs in the past.
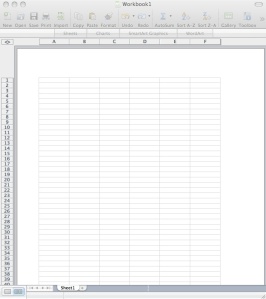
To create the tables in Excel I worked by starting with a blank spreadsheet. The image to the right is a picture of my Excel
program open to a bank sheet. You can see, everything is clearly labeled, so inputing information is not a tricky task. The sheet is divided into horizontal rows that are labeled with numbers, and vertical columns that are labeled with letters. I began in the first column creating categories of all of my expenditures. I then went online to my online bank account that had records of all of my husband and my spending for the last several years. I decided that I would use only one years worth of information to get a basic estimate of how our money was spent in the last year.
After I had all of my data inputed into the chart, I knew I wanted to find averages of these numbers to use for my next budget sheet, as well as a list of the total expenditures I made for each month. This required using the program’s mathematical capabilities. I turned to the program’s “Help” section to figure out how exactly I was to input these functions. I was able to find online help to get me through the basics.
To add up the sum of a whole column of numbers you simply enter the
function: =SUM(<name of column, top slot> : <name of column, bottom slot.) I included another image to make this more clear. You can see an example of the equation I described above in the “fx window;” this equation would give me the sum of all of the numbers found in the C column from C6 to C19. I used this skill throughout my project to find the sum of one whole column.
When I wanted to find the averages of categories of spending, so I could use these numbers in other columns, I had to use another equation. I again turned to the help center to figure out how to do averages. To find the average of one row of numbers I had to enter the function: =AVERAGE(<row and starting number>:<row and ending number>). This is also shown in the image to the right. In the example I was trying to get the average of the 7th row, columns B through O.
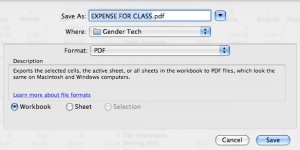
To get my tables into an appropriate format for the assignment, I went under “Save as…” under “file.” I could click on the format option and change the document format to PDF, instead of just an excel file, that wouldn’t have fulfilled the requirement.
Excel is a program that has to be purchased to be used. You can buy it for Macintosh from the Microsoft online store, and of course you can also also buy this product for Windows as well. Both versions will run you between $150-$200 as most versions come in a pack with Microsoft Word, and Powerpoint.
This was a new experience for me, but I found the work rewarding when I had nice clean tables to show for all my hard work. The help tools that came with the program were very helpful for me, and I had no problem working my way through the program. I feel that I would definitely use this program again in the future, now that I have taken the time to learn how to use it. It is something I could see myself using to keep better track of my finances, as well as something I could use to document other “dreams” I would like to accomplish. The program also made very tidy looking tables when they were put into PDF formating, and I could see myself using that in my future classes.


